

Thank you to those who responded. This report does not include a longitudinal analysis as the survey questions were changed this year to capture the data more accurately. This report serves as a snapshot for the period 2025-2026. A longitudinal analysis will be done at a later stage as extra work is required to accurately compare the data from previous years.
This year, 168 out of 412 eligible members completed the survey (41% response rate). Separate surveys were used for Fellows and trainees: the trainee version was shorter to avoid repeating Torohia questions, while the Fellow version was longer and included the same Torohia items asked of trainees. Because both groups answered identical questions on clinical work, workplace details, remuneration, entitlements and leave, their results were analysed together. Fellows also completed additional questions on workplace support, wellbeing culture, and bullying, harassment and discrimination. This has not been included in this post.
Of the 168 respondents, 97 were Fellows, 26 Senior Registrars, 36 Registrars, 6 Medical Directors, 2 GP Specialists, and 1 general scope. The GP specialists and general scope doctor were not included in the analysis given the small numbers and their unique circumstances.
The survey was anonymous, relies on the honesty of respondents and that they checked their answers fully before submitting the survey.
Urgent Care Clinical Work
The workforce was almost evenly split between contractors (82) and employees (80). There were slightly more Fellows and Senior Registrars that were contractors, at 60% and 53%. Registrars and Medical Directors were mostly employees, at 73% and 83%.
Most respondents (82%) had one Urgent Care employer; 13% had two, and 6% had three or more. A large majority (77%) were based in major urban centres such as Auckland, Wellington, and Christchurch. Another 15% were in regional centres like Whangārei, Rotorua, and Invercargill, and 8% were in towns.
Regarding workplace settings, 39% worked in stand‑alone urgent care clinics, 22% in clinics attached to general practice, 16% in Emergency Departments, and 21% in Urgent Care clinics integrated with General Practice. Only 2% worked in Urgent Care clinics attached to Health NZ institutions. The geography and distribution of where Urgent Care doctors are working will be released in the Annual Report.
Hourly rate
- Fellows earned the highest rates overall, with contractors averaging $174/hour and employees $131/hour. Contractor Fellows also show the widest range, with outlier respondents ranging between $104/hour to $375/hour.
- Senior registrars follow, with contractors averaging $165/hour and employees $118/hour.
- Registrars show a similar pattern — contractors average $156/hour, while employees average $107/hour.
- Medical directors averaged $146/hour for employees. Only one contractor Medical Director responded, earning $250/hour; this single data point was included, but a box‑and‑whisker chart couldn’t be produced.
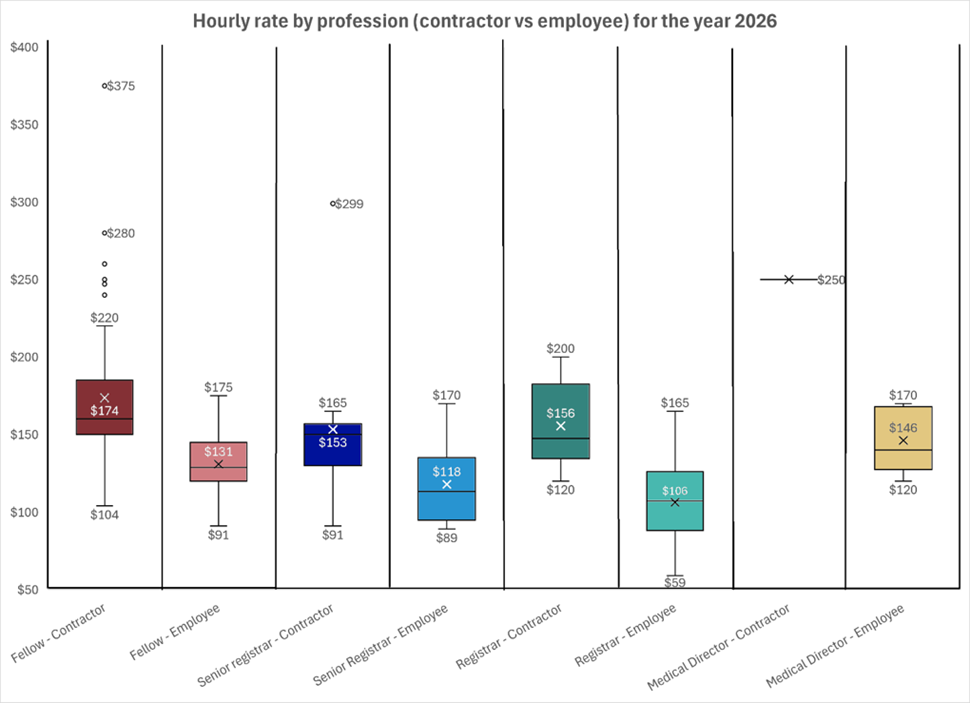
Working hours and after-hours loading rates
In 2026, the mean number of baseline hours worked per week in urgent care across all professions was 24.65 per week. The mean number of after‑hours worked were: 4.68 hours after 8 pm, 1.8 hours on night shift and 6 hours for weekends. However, this differs drastically by profession.
Fellows
Fellows worked an average of 23 baseline hours per week.
- 42% worked after 8 pm, averaging 8 hours.
- 10% worked night shifts, averaging 12.1 hours.
- 55% worked weekends, averaging 6.3 hours.
Their average loading rates were: 1.2x after 8 pm, 1.47x for night shifts, 1.24x for weekends, and 1.4x for public holidays.
Senior registrars
Senior registrars worked an average of 24 baseline hours per week.
- 37% worked after 8pm, averaging 8.75 hours.
- 15% worked nightshift, averaging 12.1 hours.
- 61% worked weekends, averaging 8 hours.
The average loading rates were: 1.3x after 8pm, 1.6x for nightshift, 1.3x for weekends and 1.5x for public holidays.
Registrars
Registrars worked an average of 31 baseline hours per week.
- 62% worked after 8pm, averaging 22 hours per week.
- 30% worked nightshift, averaging 5 hours.
- 58% worked weekends, averaging 7 hours.
The average loading rates were 1.2x after 8pm, 1.625x for nightshift, 1.24 for weekends and 1.57 for public holidays.
Medical Directors
Medical Directors worked on average 33 baseline hours per week.
- 16% worked after 8pm, averaging 10 hours.
- No Medical Director reported working nightshifts.
- 83% worked on the weekends, averaging 7.3 hours per week.
Please be mindful of the small sample size of MDs, as only 6 completed the survey.
Leave and CME allowance
Paid annual leave to employees averaged 23 days per year – ranging between 20-40 per year (full-time equivalent). Employees received an average of 12 days of sick leave per year. Employees get an average of 5.7 days of CME leave per year, and an average CME allowance of $4500 per year. However, this depends on profession (i.e. registrar vs Fellow). CME allowance is generally higher for employees working in Emergency Medicine or at an institution associated with HNZ, with an average of $10,000 per year. A small number of contractors received CME leave or a CME allowance. Those who did, average 5.3 CME days per year and $2,095 in a CME allowance .