Thank you to those who responded. This year’s workforce survey is slightly different, as a longitudinal analysis was done to compare the results this year with previous years. Click here for the full report.
This year’s response achieved a record-high level of participation, with 181 respondents, which equates to a response rate of 43%. This represents a 69% increase compared to 2024.
While we include General Practitioners and Doctors with financial stakes in clinics in our questionnaire, the numbers were so small and their circumstances diverse that they have not been included in calculations.
The survey was anonymous, and we do rely on the honesty and maths of responders. Consequently, educated guesses as to the meaning of some answers had to be made.
Of the workforce, 84 were contractors, 94 were employees, and three had financial interests in the clinic.
To provide a valid comparison, salaried doctors were converted to an hourly rate, taking into account their hours, base salary, annual leave declared, 3% Kiwisaver, ACC levy, and assuming the employer pays Indemnity Insurance, College membership, MCNZ fees and CME leave pro rata. Sick leave, although asked, was not taken into consideration.
The question relating to “After Hours” naturally covered several areas (evening, night, weekend, and statutory holiday). Where specified the Statutory Holiday payments/time in lieu were excluded.
Any numbers in parentheses not otherwise specified are those from last year.
The practice definitions in the survey were not highly detailed, leaving it up to the respondents to decide on the most appropriate labels for their situation,
City= Central City
Town= regional town
Suburban = Not central urban area
GP attach = attached but not integrated
GP integrated = GP and UC staff and cases mix
ED = DHB ED
Attach DHB = Urgent Care attached to DHB Facility
This year, by request, we have also divided responses geographically, South Island and Upper/Lower North Island. Interestingly, there didn’t seem to be much in the way of regional differences.
Working hours
In 2025, the mean number of hours worked in urgent care was 23.72. There has been a 7% decline in the mean number of hours worked since 2024, and a 25% decline in the mean number of hours worked between 2025 and 2022. 7.7% of doctors reported an average work week in excess of 40 hours (4% last year). The mean number of hours worked for registrars was 23, Fellows 22.5, clinical directors 37.5The mean number of hours worked per week for contractors was 16, for employees 33, and for partners/shareholders 44.
After hours of loading
Overall, the after-hours loading averaged about 15%; however, notably, many employees had no after-hours loading, leading one to assume it was built into their salary.
Urgent care registrars
Base hourly rate varied ($94 to $191) per hour, with a mean of $133 ($135). In contrast to last year, contracted doctors in general had significantly higher hourly rates. In terms of the type of clinic and region, registrars working in rural areas were paid more, but the number of participants is too small to make a direct comparison.
Senior urgent care registrars
Senior Registrars’ average hourly rate was $147 for employed Drs and $158 for those on contract, with a mean of $150 (Range $82 to $260) and an after-hours loading of about 17%. The vast majority of Senior Registrars were based in the central city, so location differences were not significant, and neither were regional differences.
Fellows (vocationally registered without a management Role)
For those Urgent Care and GP Fellows not in a management role, the equivalent hourly rate varied between $100 and $300 per hour with an average of $165 ($163) per hour. After-hours rates averaged $187, but, notably, almost all after-hours loadings were less than 30%, with an average of 24% for Fellows.
This year, employees earned more per hour than contractors ($171 vs $159) after adjusting for the hourly rate. There was no significant difference in hourly rate by geography for Fellows.
Clinical/ Medical Directors
CD response to this survey was much higher than in previous years, with 21 responses to the survey this year. Clinical/Medical Directors as employees have had an increase in average pay (from $174 to $196 per hour) while contractors decreased from $166 to $176 per hour last year. There was no significant difference in the hourly rate by different geographic regions.
Annual leave
Paid annual leave to employees averaged 25 days per year – range 20-35 per year. ED(DHB) doctors were all allowed 30 days of paid annual leave per year. This is the same as last year and 2023.
CME leave and allowances
This year, the majority of contractors did not get a CME allowance (90% put down $0 or did not answer the question. The remaining 10% received an average CME allowance of $4,625 (ranging between $1,000-$13,000). The average CME allowance for employees is $6,895. Employees who are working at emergency departments received the highest CME allowance (with an average of $12,877).
Peer review groups
Paid peer review groups seem to be on the increase -As in previous years, few contractors had paid peer review time (17%), similar to last year. 43% of employees did also get paid Peer Review time, which is 10% higher than last year.
Staffing levels
15% stated that clinics were adequately staffed to meet patient flows, and 49% responded with mostly adequate. This is similar to last year, and an improvement from 2023.
Closures
Clinic closures appear (to the College) to have increased in the past year.
64% of respondents reported the clinic had to close during their usual hours.
The reasons given were a doctor shortage (44%), doctor illness (25%), nurse shortage (11%), and other reasons (11%).
Plans for the next 5 years
85% of respondents plan on staying in urgent care for the foreseeable future (5 years).
The plans of members for the next 5 years showed a clear trend with seniority:
Fellows – 20% planning to leave urgent care, with retirement stated as the main reason. 10% of Fellows plan on reducing their hours.
Senior Registrars – 8% planning to leave urgent care, 20% to reduce hours, 25% to increase hours
Registrars 8% planning to leave urgent care, 20% to reduce hours
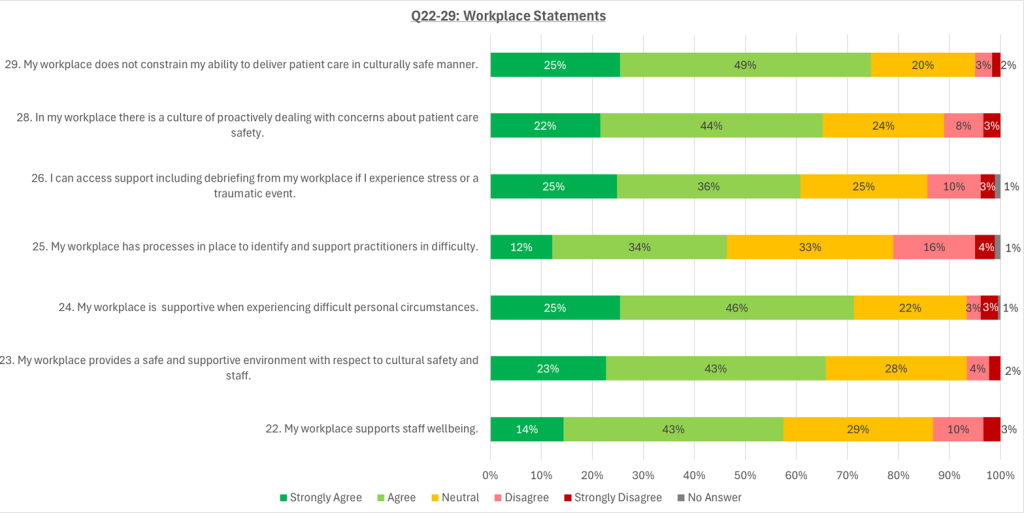
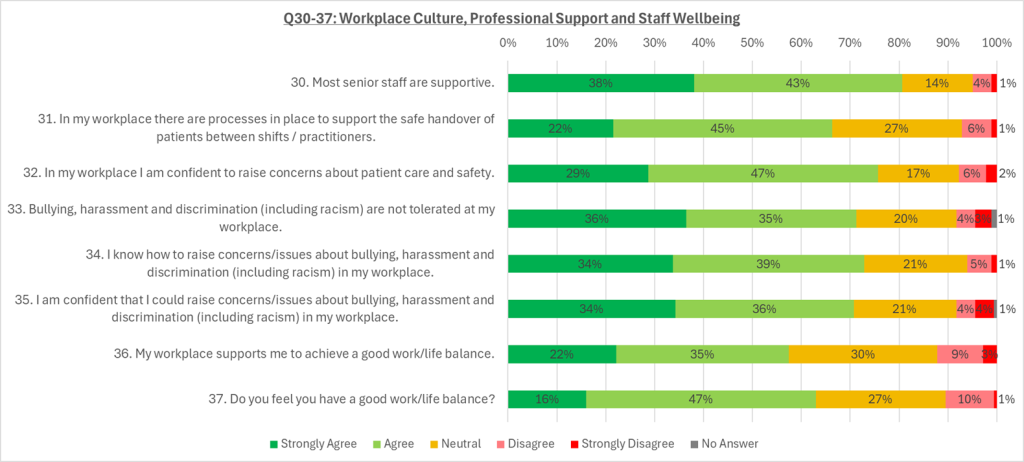
In the workplace
Interestingly, CDs – 90% plan on staying in urgent care with 65% keeping their hours or increasing them.
In the workplace